CICD for Automated Testing
Table of contents
Yo! We’ve recently made some enhancements to how our playwright testing is running into our website. You can checkout the full details in this article here!
But for today, we’ll be talking about CICD, and how we hooked up our automated testing script into the CICD environment.
Standard Scripting Process
So, we first tested the scripts locally ofcourse – this is mainly done by running npx playwright test <test-file>. This runs our script locally – and once we are sure that it will succeed, we can proceed to ensure that our GitLab script will also execute it.
Standard Notification Scripting
Even for our notifications, we first test using the curl command manually. As we want to send the following:
- Notification regarding the pipeline completed
- Test results
- Link to access the test results etc.
The test curl script we used was as follows:
curl -X POST -H "Content-Type: application/json" \
  -d '{
    "text": "🔔 *Test Notification*: GitLab pipeline started for commit '${CI_COMMIT_SHA}'. [Pipeline Link]('${CI_PIPELINE_URL}')\n\nYou can access the test results here: https://test-results.petcoach.sg/\n\nTest Results:\n\nChromium: '${CHROMIUM_STATS}'\nFirefox: '${FIREFOX_STATS}'\nWebkit: '${WEBKIT_STATS}'"
  }' \
  "https://chat.googleapis.com/v1/spaces/AAAArReRpYA/messages?key=specialkey"
Once we confirmed that we were able to receive the results, as seen in the screenshot below: 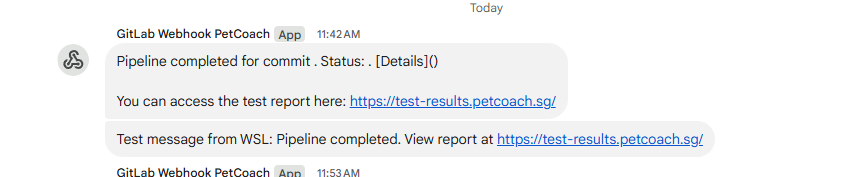
We proceeded to hook this script up in our GitLab YAML file as well.
GitLab YAML
Now this is the beast, the brain of everything. So we’ll break down our plan here!
We plan to have 4 stages:
- generate
- test
- deploy
- notify
Each stage will have their own dedicated scope!
Generate Stage
In the Generate Stage, we actually generated the test script based on the URLs that are available in our sitemap.
You can checkout further details regarding how this script is created in our article on automated playwright testing enhancements here!
Script is as follows:
generate_tests:
  stage: generate
  image: node:18
  script:
    - npm install
    - npx playwright install
    - npx ts-node tests/generateTests.ts
  artifacts:
    paths:
      - tests/generated-tests.spec.ts
    expire_in: 1 hour
See visual representation of the generate test script job: 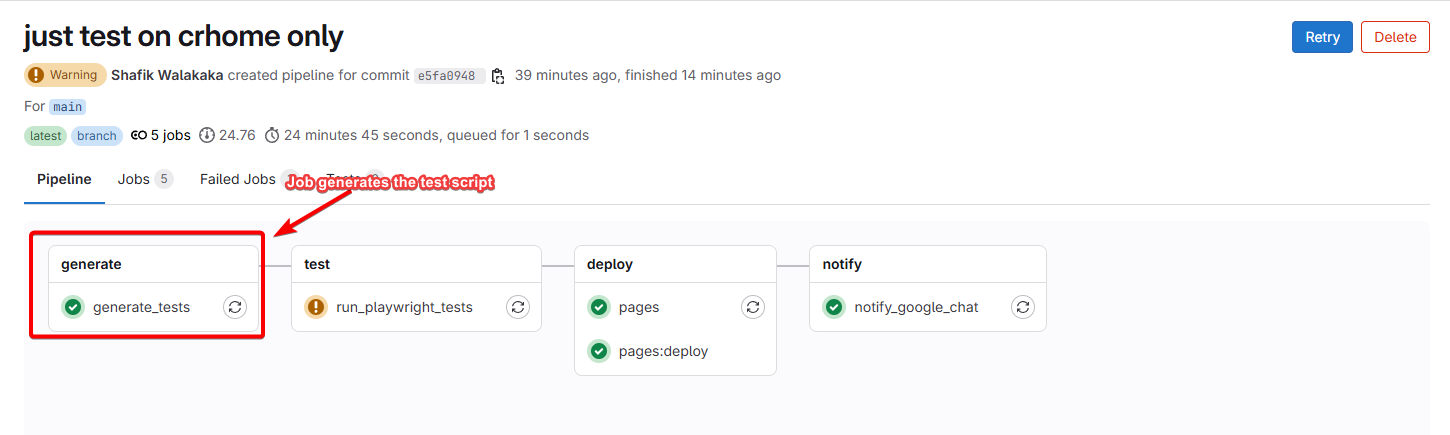
And if we click in to inspect what goes in within the runner:
- You can see the job grabbing the URLs from the sitemaps
- And then generating the test script, for the next jobs consumption
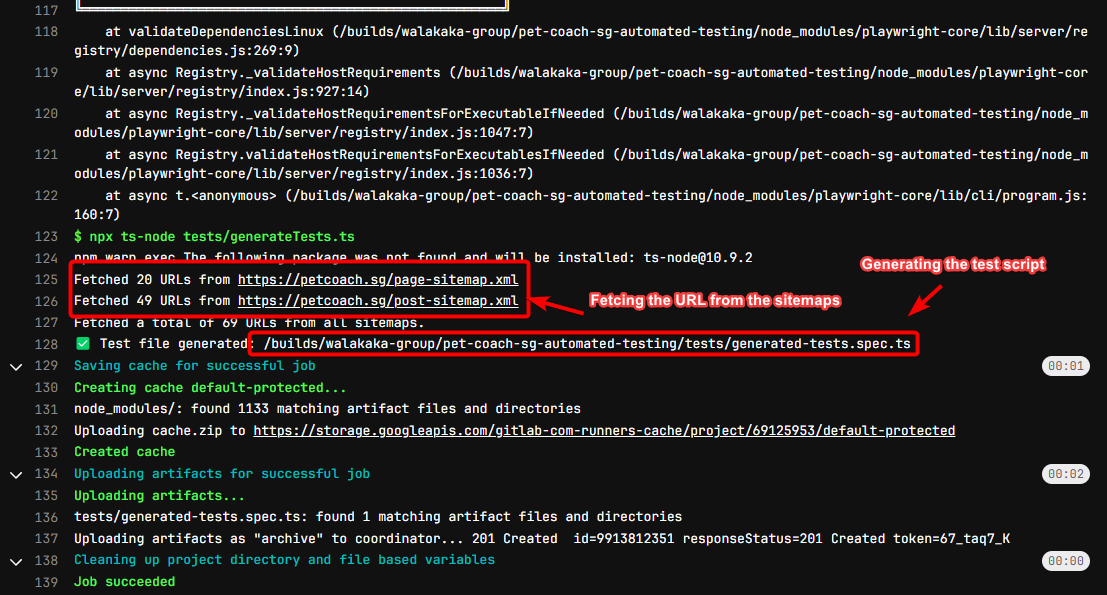
So, the key point to note is that:
- The generated file will be placed in the artifacts
- Generated file will be available at
tests/generated-tests.spec.ts
This is crucial because it will be referenced by the next job – the test job. This is the job that actually runs the test.
Test Job
So the first job, generates the test script dynamically, based on the URLs available in our sitemaps. The test job, executes that script using playright:
run_playwright_tests:
  stage: test
  image: mcr.microsoft.com/playwright:v1.52.0-jammy
  script:
    - npm install
    - npm run test:e2e
  artifacts:
    when: always                # Always upload artifacts, even on failure
    paths:
      - test-results/      # This is where Playwright stores its test results by default
      - playwright-report/  # This folder contains Playwright's HTML reports
  when: always  # 👈 Ensure this job always runs regardless of previous job status
  allow_failure: true  # 👈 Optional: lets GitLab mark this job as "allowed to fail"
Key points to note are as follows:
- Allow failure, that means failure of this job does not block subsequent jobs from running
- Artifacts are always pushed – even if there are failures. This allows us to get the results even if some of the test case fails
Because we don’t expect all test cases to pass, even if some test cases fails – we want to ensure that subsequent jobs are running: 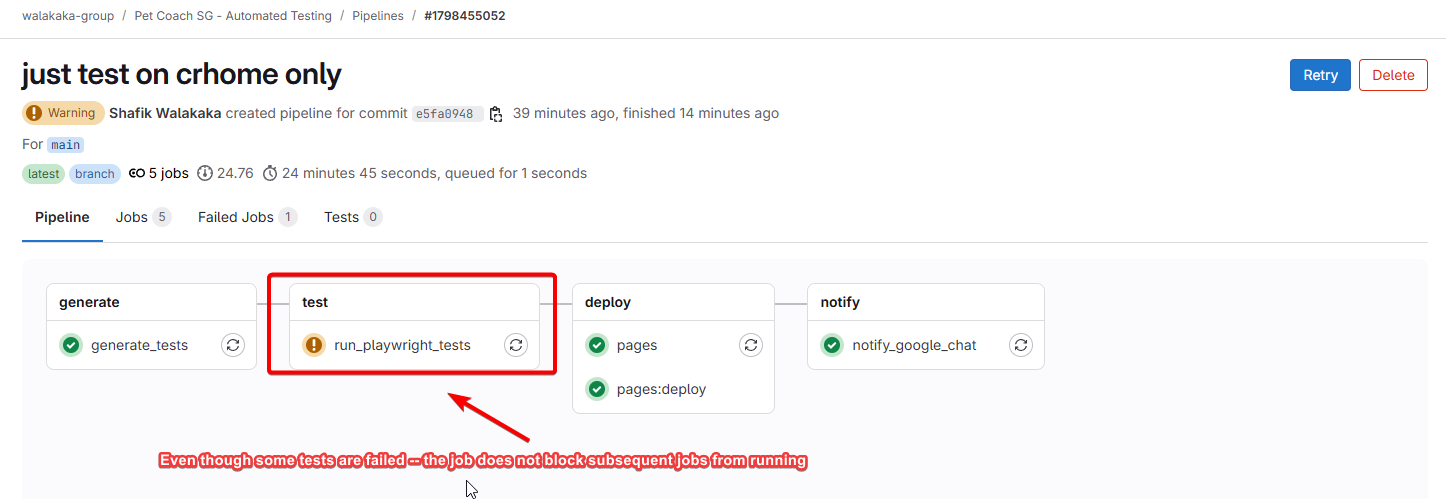
And if you inspect the test job – indeed you can see failed jobs: 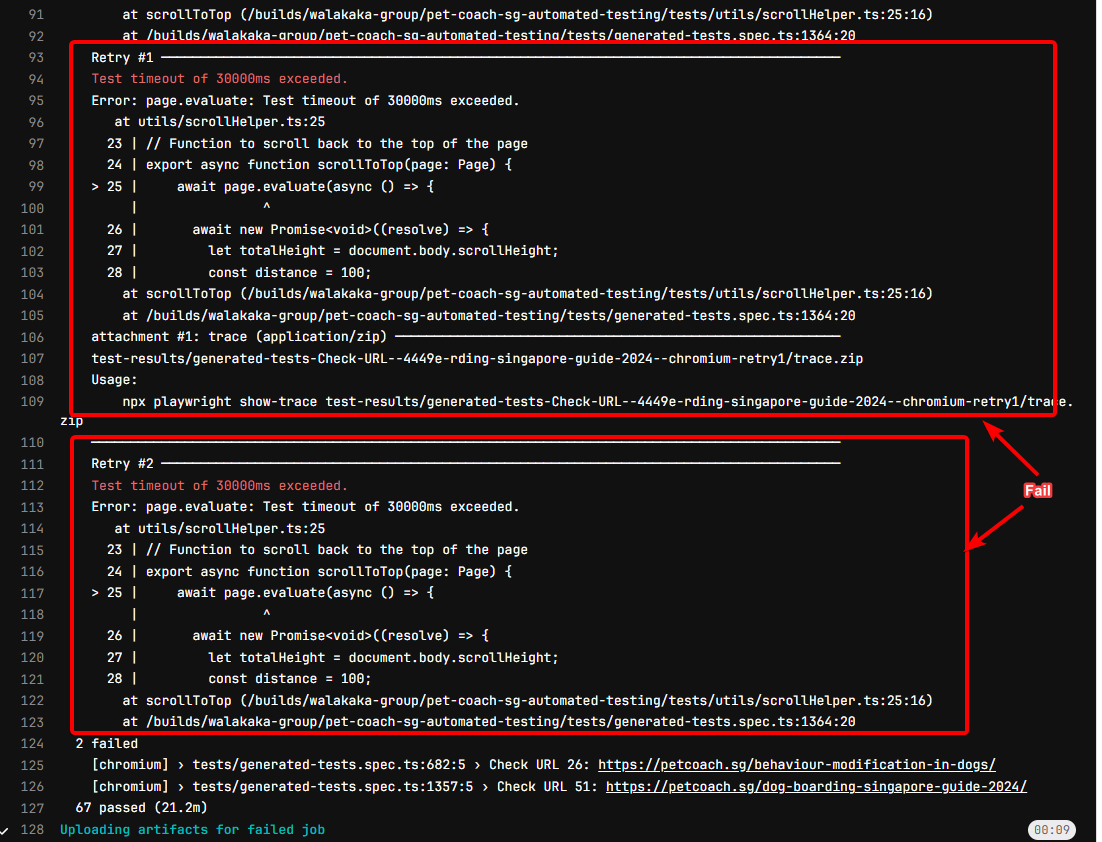
But if you see the summary, only 2/29 of the test failed! And artifacts are still uploaded, so that they can be used by subsequent jobs! 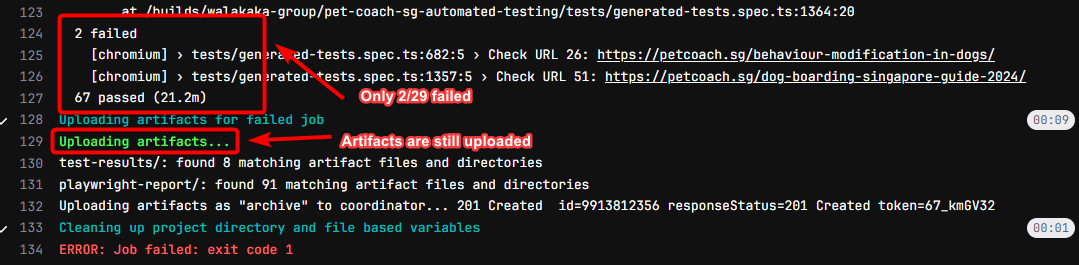
Deploy Job
Now that we have generated the test script, and executed the test script, we’ll want to see the results! To do that, we hooked up our CICD pipeline with GitLab pages, so that it’s easy for our business users to inspect the test results!
The script for the deploy job is as follows:
pages:
  stage: deploy
  script:
    - mkdir -p public
    - cp -r playwright-report/* public/
  artifacts:
    paths:
      - public
  only:
    - main  # or the branch you want to deploy from
  when: always  # 👈 Ensure this job always runs regardless of previous job status
Key points to note is that:
- Create a public folder
- Copy the artifacts that we want to display in the gitlab page into the public folder
GitLab pages will serve results from the public folder. See our test results hosted on GitLab pages here!
Screenshot for your reference of what the playwright report actually looks like: 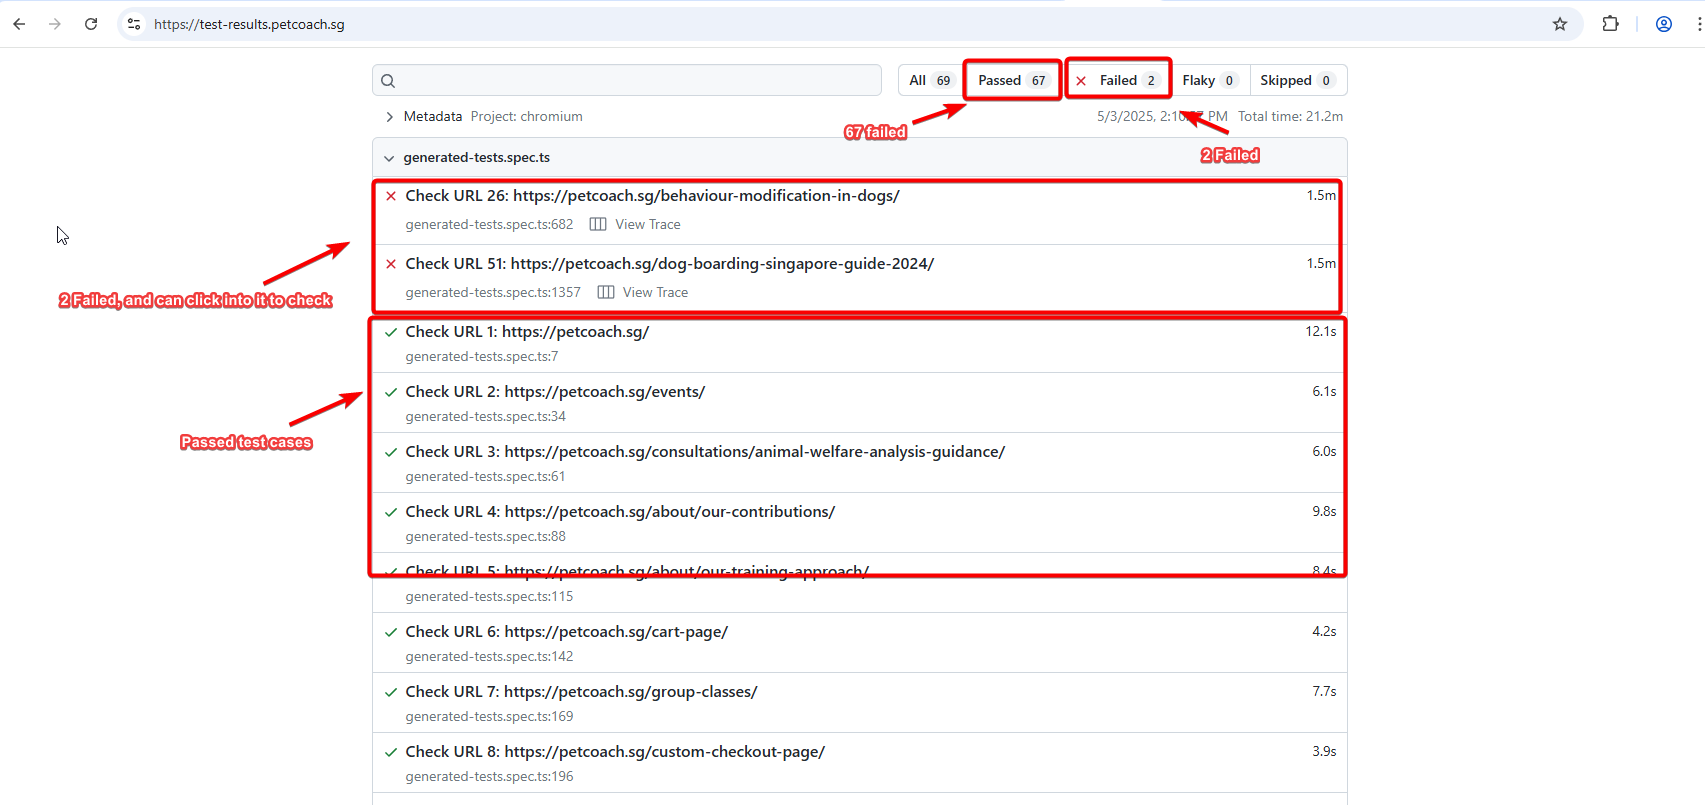
And then, if you click into the failed test scenario – you can even see the reason for failure!
- For this case, timeout of 30 seconds for all retries
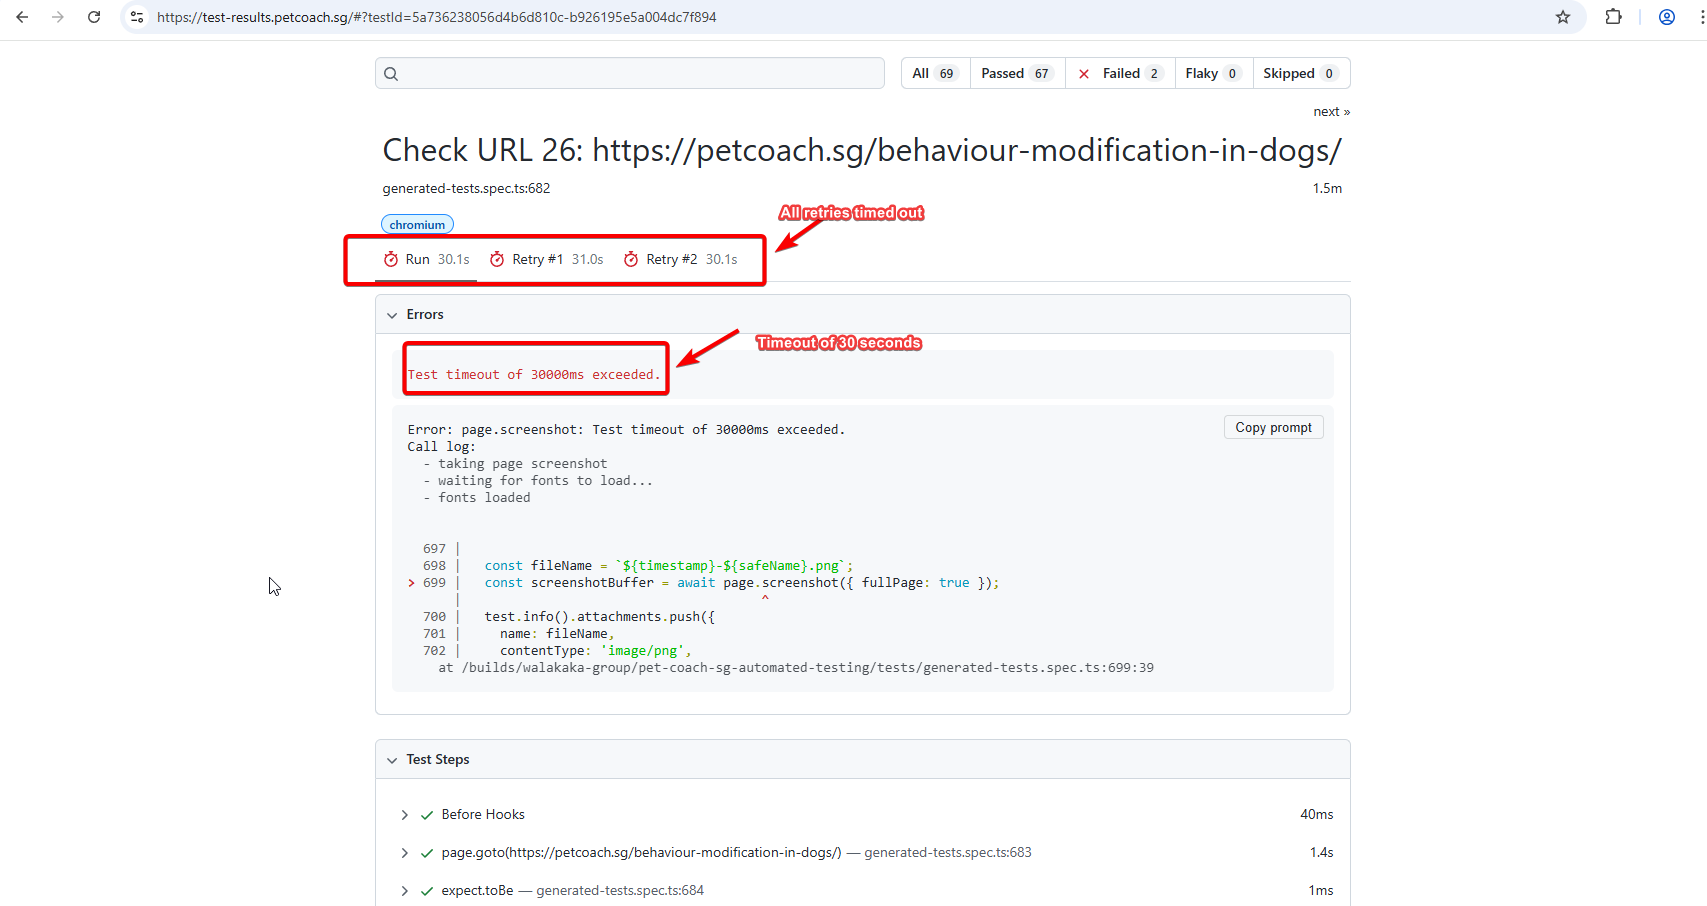
On the retry, you can actually inspect the tracefile, to further understand where the failure occurred: 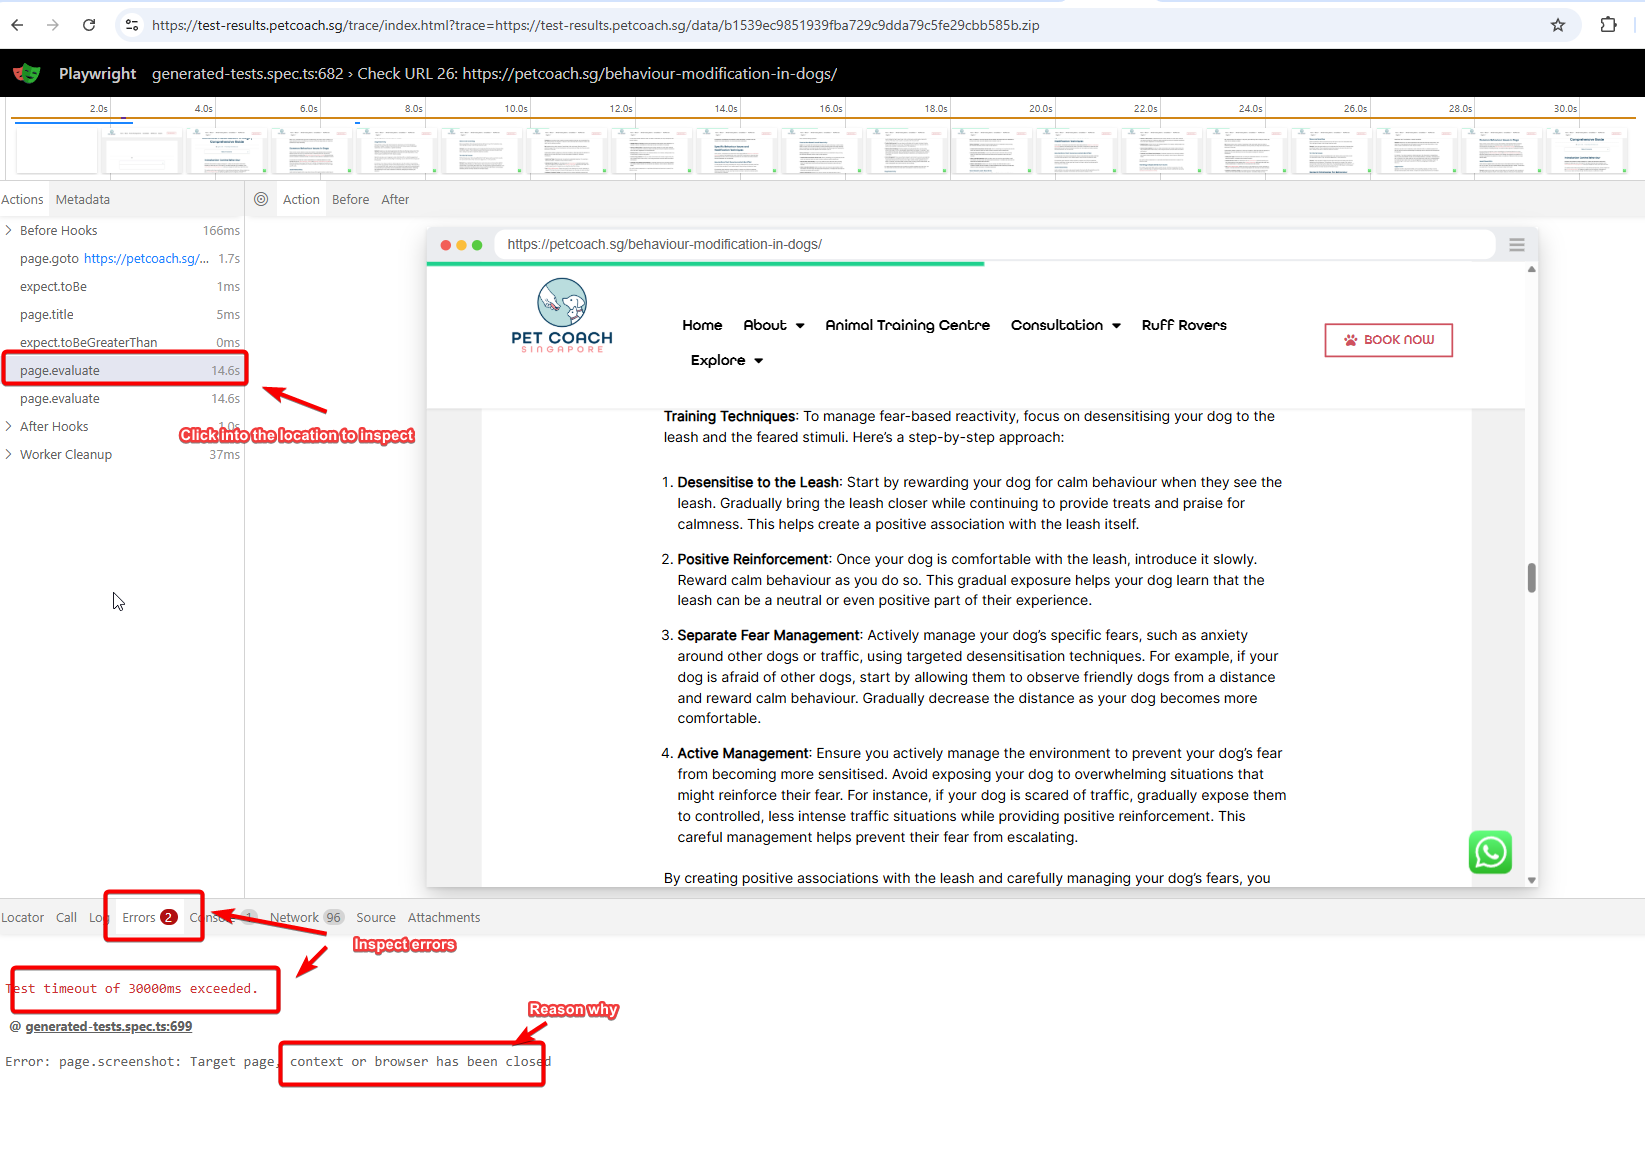
In this case, we can see that for some reason the browser context was closed. Hmm – odd, would require further debugging as i’m not too clear on this one, but at least it gives us a starting point.
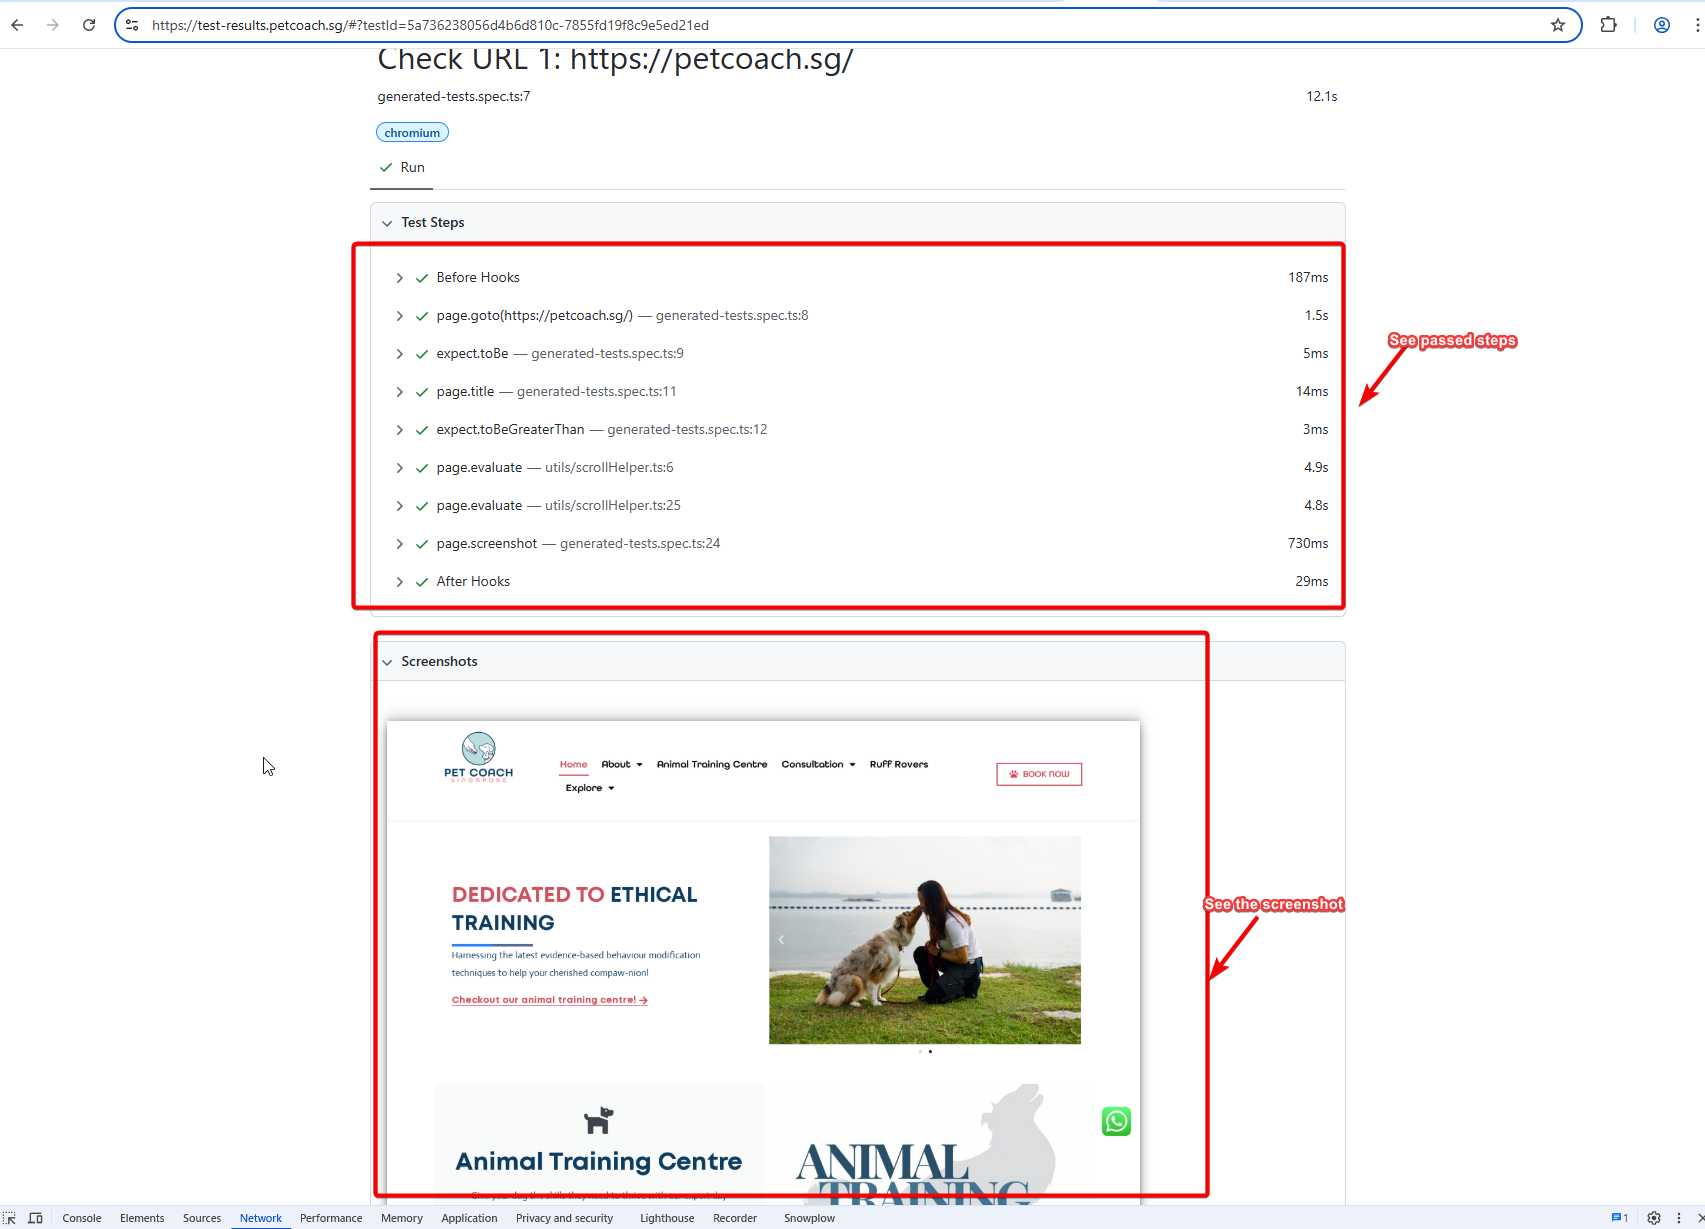
And for passed test cases, you can inspect:
- The steps that were passed
- And the screenshot, to further verify that indeed your website is looking as per expected
Notification Job
Last job is the notification job, so that we can notify our stakeholders that the test is successful:
notify_google_chat:
  stage: notify
  script:
    - apt-get update && apt-get install -y libxml2-utils

    # Extract JUnit stats for each browser
    - |
      extract_stats() {
        local BROWSER=$1
        echo "$(xmllint --xpath "string(//testsuite[@hostname='$BROWSER']/@tests)" playwright-report/results.xml) tests, \
        $(xmllint --xpath "string(//testsuite[@hostname='$BROWSER']/@failures)" playwright-report/results.xml) failed, \
        $(xmllint --xpath "string(//testsuite[@hostname='$BROWSER']/@skipped)" playwright-report/results.xml) skipped, \
        $(xmllint --xpath "string(//testsuite[@hostname='$BROWSER']/@errors)" playwright-report/results.xml) errors, \
        $(xmllint --xpath "string(//testsuite[@hostname='$BROWSER']/@time)" playwright-report/results.xml)s"
      }

    - CHROMIUM_STATS=$(extract_stats chromium)
    - FIREFOX_STATS=$(extract_stats firefox)
    - WEBKIT_STATS=$(extract_stats webkit)
    - |
      MESSAGE=$(cat <<EOF
      {
        "text": "🔔 *Test Notification*: GitLab pipeline started for commit ${CI_COMMIT_SHA}. [Pipeline Link](${CI_PIPELINE_URL})\n\nYou can access the test results here: https://test-results.petcoach.sg/\n\nTest Results:\n\nChromium: $CHROMIUM_STATS\nFirefox: $FIREFOX_STATS\nWebkit: $WEBKIT_STATS"
      }
      EOF
      )
      curl -X POST -H "Content-Type: application/json" \
        -d "$MESSAGE" \
        "https://chat.googleapis.com/v1/spaces/AAAArReRpYA/messages?key=secret-key"
  only:
    - main  # Optional: Trigger only for the 'main' branch or a specific branch
  when: always
Main thing to note is that:
- We included the link to reach our test result page
- And we also included the test results in Junit format (e.g., 2 fail, 67 pass) – that way, our business users can easily, have a sensing of how much problems their site have
See the screenshot for reference: 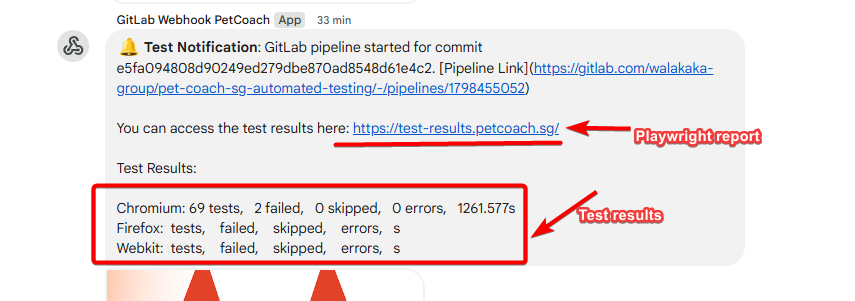
Conclusion,Thank you!
And that’s all folks :)! Fully automated testing, in GitLab CICD pipeline, and we also have notifications set up to inform our stakeholders of testing progress.
Slowly, yet surely getting there. Obviously not pro level – but I think for a one man show, this is pretty sick (lol self praise).
Cheers Shafik