The Sunk-Cost Question, Projected Forward: Was Surrendering the Right Call?
Table of contents
- The question, precisely
- Step 1: a real growth rate for each side, not a guess
- Step 2: two honest scenarios for “keep paying,” not one convenient one
- The projection
- The one result that wasn’t a landslide
- The real-world wrinkle a pure numbers model can’t answer
- What this actually took
- Where this landed
Last post established that none of three insurance policies — two investment-linked, one traditional whole life — beat a plain world-index fund over their real, historical lifespans. That’s a backward-looking fact. It doesn’t, on its own, answer the actual decision in front of a family member of mine: surrendering now locks in today’s underwater number as a realized loss. Is that actually the right call, or was a recovery about to happen anyway?
That needs a forward-looking model, not a historical one — and building it honestly produced one result that genuinely wasn’t a landslide, which is the more useful finding than three easy wins would have been.
Same genericisation as the previous post: no names, and the dollar figures shown are representative, not the real numbers — swapped out to keep the family member’s finances private. Real product categories and methodology throughout.
Updated 2026-08-30. The previous post corrected an error: an earlier pass blended the actual cost of protection (CI/TPD charges) together with the ILP’s separate distribution/admin cost into one “fee drag” number. That correction changes two things here: ILP #2’s “real underlying funds, no fees” growth rate below is now computed on the amount that was actually invested, not the full premium (a more conservative, more accurate basis), and the “why ILP #2 is the close call” explanation further down now points at protection cost specifically, not a generic “fee structure.” The forward-projection numbers themselves barely move at this level of rounding — the conclusion is unchanged — but the reasoning behind them is now correct.
The question, precisely
For each policy: project forward for the same number of years it’s already been running (roughly 9, 4, and 15 years respectively) — comparing “keep paying the same premium into the existing policy” against “surrender today, invest the proceeds plus the freed-up premium instead.” Both sides get to use a real, historically-derived growth rate — not an optimistic made-up number on one side and a pessimistic one on the other.
Step 1: a real growth rate for each side, not a guess
XIRR (money-weighted return) computed directly from each policy’s actual cash-flow history — every real contribution date and amount, against the real value today:
| Actual account (what really happened, full premium) | Real underlying funds, invested amount only, no fees | World-index equivalent, same invested amount | |
|---|---|---|---|
| ILP #1 | −3.2%/yr | +5.2%/yr | +13.3%/yr |
| ILP #2 | −23.6%/yr | +14.9%/yr | +16.9%/yr |
| Whole life | −4.0%/yr | n/a (not unit-linked) | +8.9%/yr |
XIRR here means: given exactly when money went in and what it’s worth today, what single annualized rate explains that? A standard, checkable calculation (Excel’s XIRR() does the same thing) — not a custom metric invented for this post.
Step 2: two honest scenarios for “keep paying,” not one convenient one
“Keep the policy” was modeled two ways, both starting from today’s real value, both continuing the same real premium:
- Pessimistic: continues at that policy’s own actual-account XIRR — i.e., whatever caused the historical gap keeps happening at the same rate. For insurance-linked products specifically, this is the more realistic assumption, because the underlying charges are age-banded and typically rise, not fall, as the insured ages.
- Optimistic: continues at the real underlying-fund XIRR instead — computed on the amount actually invested, not the full premium — a deliberately generous assumption that protection and admin costs somehow stop mattering from here on. Included specifically so the comparison isn’t a strawman.
“Surrender and invest” used the world-index XIRR, applied to today’s surrender value plus the ongoing premium that gets freed up (redirected to the same low-cost investing the family member already does consistently elsewhere — a real precondition to this whole plan, not an assumption to skip past).
The projection
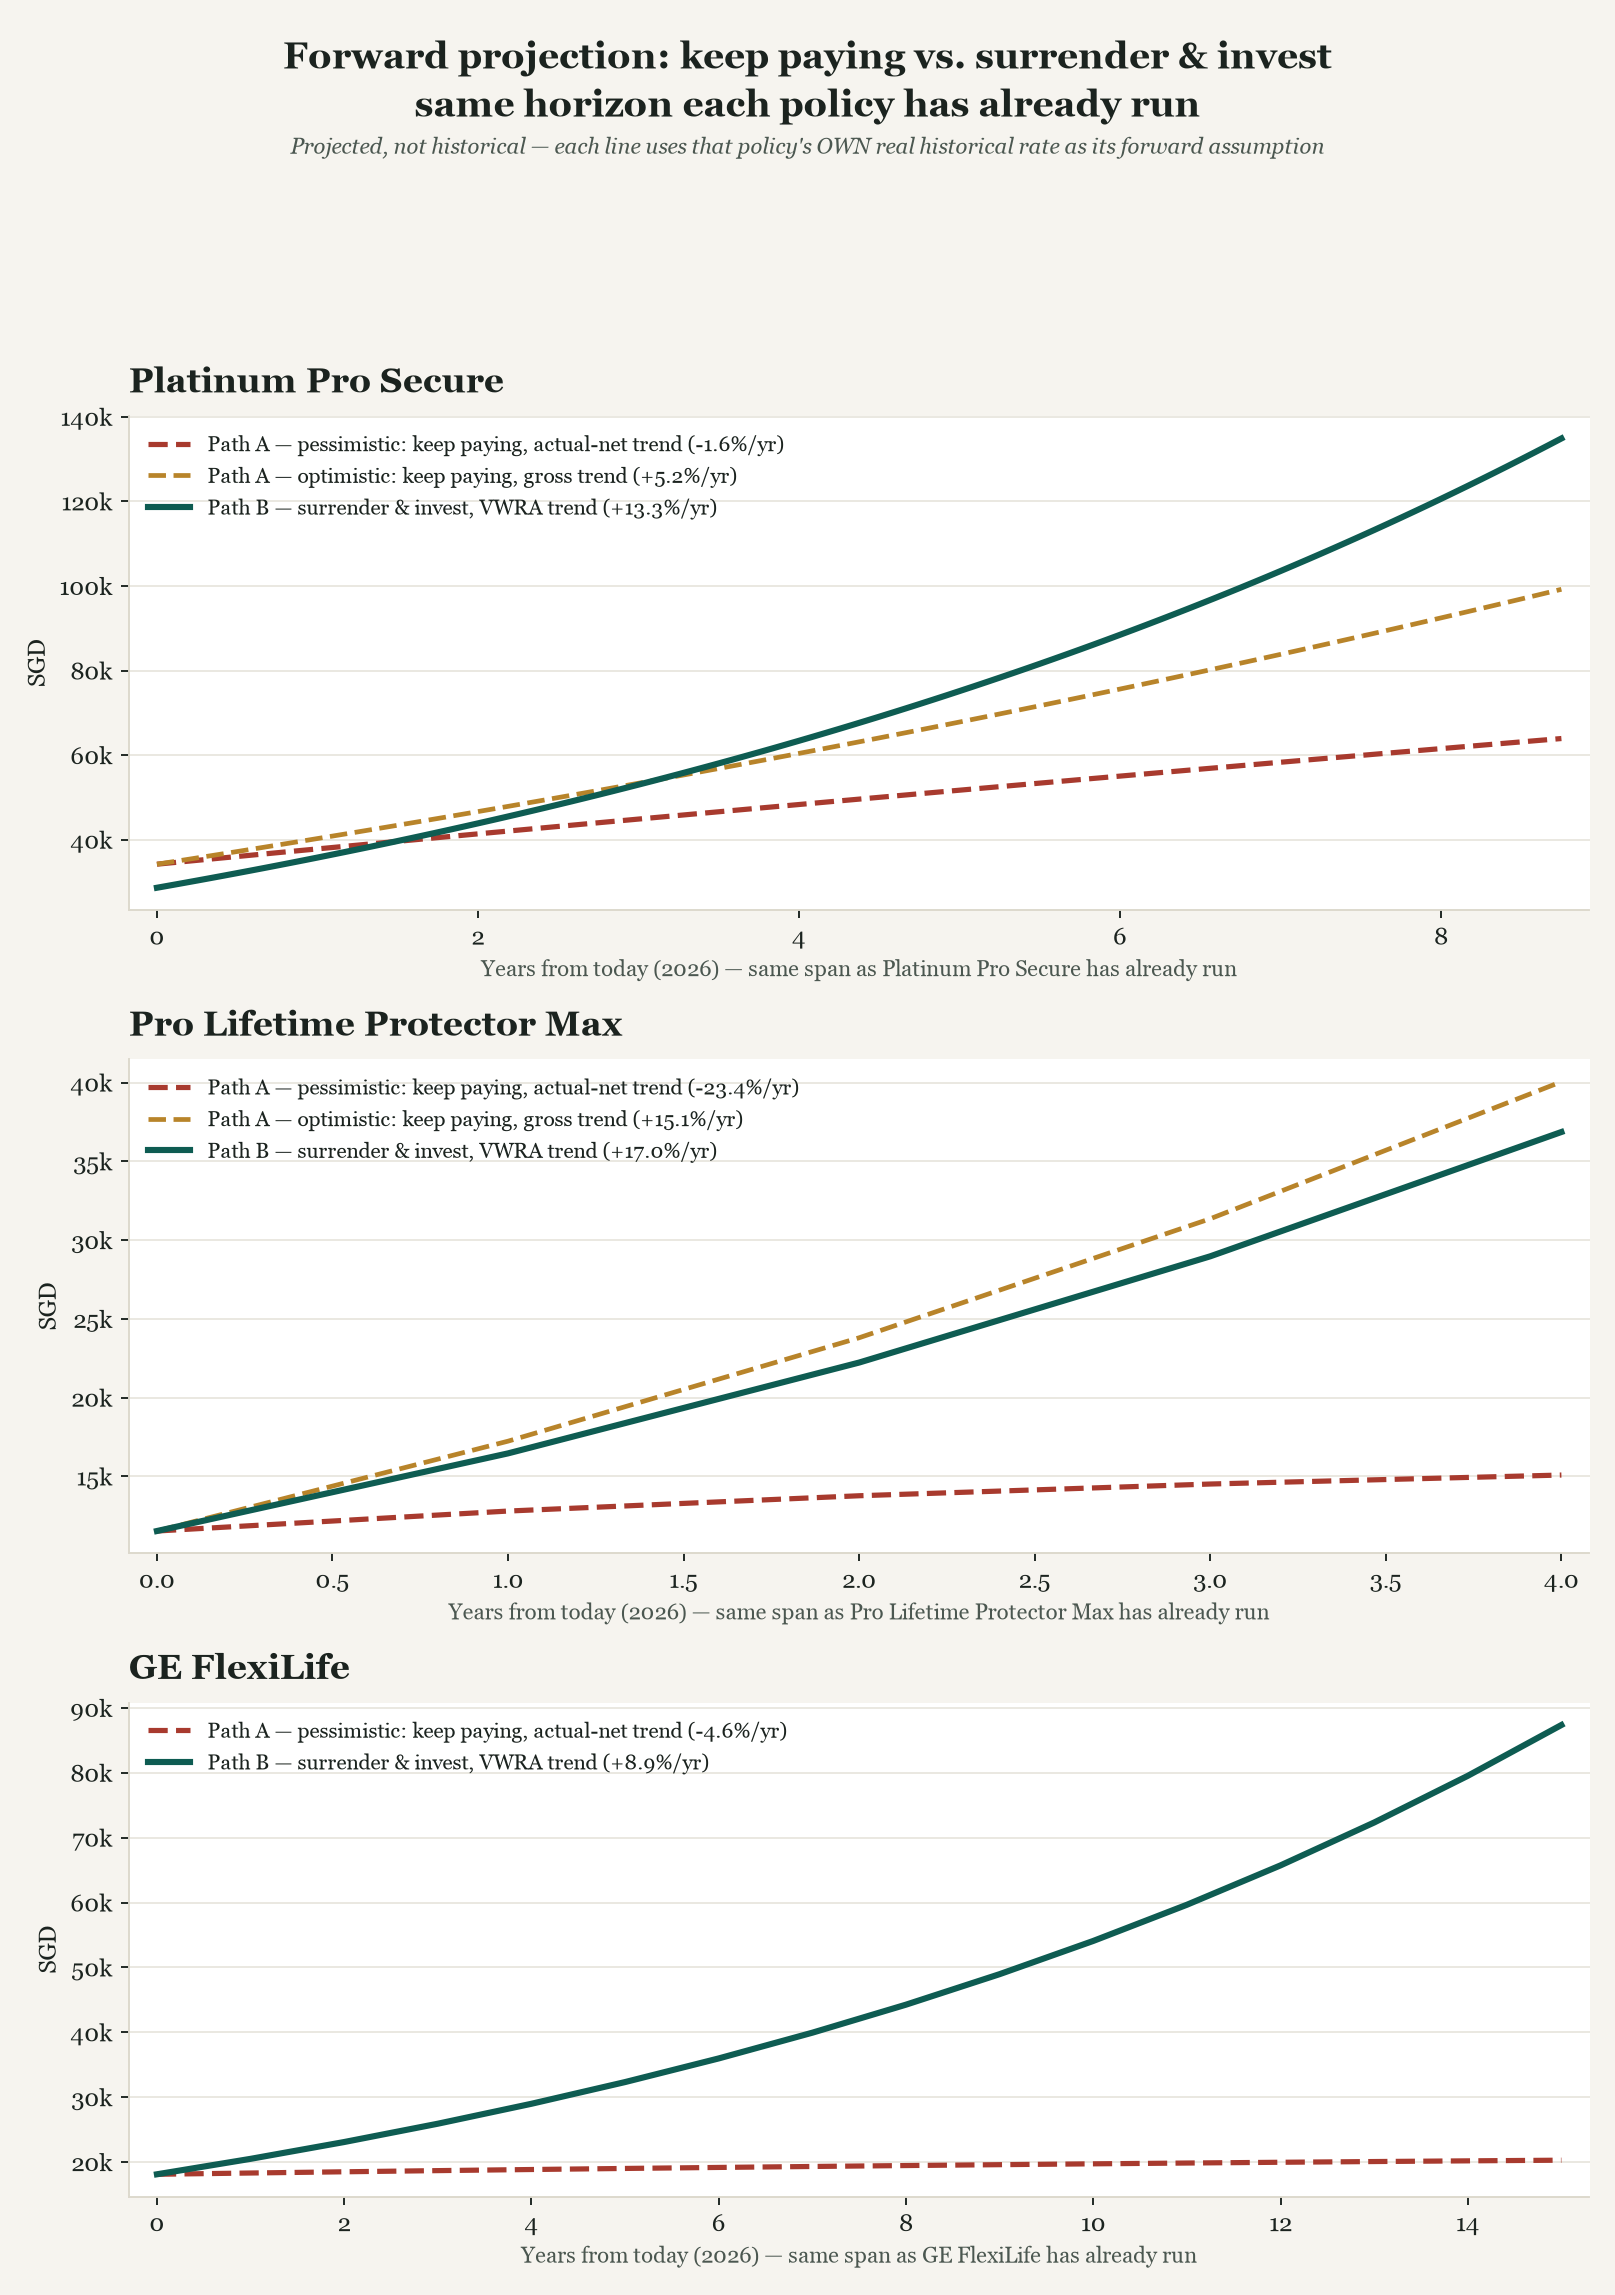
| Policy | Forward horizon | Keep paying — pessimistic | Keep paying — optimistic | Surrender & invest |
|---|---|---|---|---|
| ILP #1 | +9 years | ~SGD 61,000 | ~SGD 104,000 | ~SGD 140,000 |
| ILP #2 | +4 years | ~SGD 16,000 | ~SGD 42,000 | ~SGD 39,000 |
| Whole life | +15 years | ~SGD 23,000 | n/a | ~SGD 92,000 |
The one result that wasn’t a landslide
Two of the three are clean wins for surrendering, under either scenario. The third genuinely isn’t:
On ILP #2, “surrender and invest” beats the pessimistic case comfortably, but comes in slightly behind the optimistic case. Whether surrendering wins here depends on which “keep paying” assumption is more realistic — and it isn’t a coin flip. This specific policy’s protection-cost charges — not its admin/distribution cost, which is a separate, larger deduction that never became investable capital in the first place and doesn’t show up in this particular gap — had already consumed about a quarter of its real invested growth in just four years, and those charges are contractually tied to attained age; they don’t reverse or flatten just because a projection assumes they might. The realistic scenario is the pessimistic one, or worse — which surrendering beats clearly. But it would have been dishonest to only show the version of this chart where every result is a blowout. This is what a genuinely close call looks like when you actually run the numbers instead of assuming the conclusion.
The real-world wrinkle a pure numbers model can’t answer
One more thing the spreadsheet can’t tell you: replacing an insurance-linked policy with a plain term-style product isn’t a pure math exercise — it requires fresh medical underwriting on the new policy. Anyone with any past medical history (even fully resolved, minor procedures) needs to check, before surrendering anything, what terms a new insurer would actually offer.
The practical mitigation is straightforward and doesn’t require guessing:
- Get preliminary, non-binding underwriting from at least one insurer before committing to anything.
- Get a second comparison quote — underwriting stances on the same disclosed history genuinely differ insurer to insurer.
- Only surrender the old policy once the new one is actually issued and in force — never let there be a gap where neither policy is providing cover.
This sequencing gate matters more than the spreadsheet does. A great forward projection is worthless if there’s a real coverage gap between “surrendered the old policy” and “the new one is actually active.”
What this actually took
The full arc — real fund-price data collection, the two data problems from the previous post, XIRR, this forward projection, both charts — took an AI agent about an hour of actual execution, once the approach was established. A financial analyst replicating this by hand, assuming they knew to check whether the underlying fund prices were even public, would realistically be looking at 8–16 hours: discovering the tickers, building a correct monthly/annual unit-purchase simulation with FX handling, computing XIRR properly, and writing it all up with the same level of caveat and rigor.
That gap is really the whole story here. None of the individual techniques — XIRR, dollar-cost-average simulation, a forward projection — are novel. What changed is that checking “did my insurance actually beat the market, and does the historical loss project forward into a bigger one” went from a multi-day research project most people would never actually do, to something that fits inside a working session.
Where this landed
The actual decision: surrender all three policies, replace the protection with a standalone term-style product (sized to close the coverage gaps the historical analysis also surfaced), and redirect both the surrender proceeds and the freed-up premium into the same low-cost investing already happening elsewhere — with preliminary underwriting confirmed before anything gets surrendered, per the sequencing gate above.
None of this is financial advice — it’s one family’s specific numbers, projected with real data and honestly-disclosed assumptions. The methodology is the reusable part; the conclusion is specific to these three policies.
Until next time, peace and love!