Total Cholesterol, HDL & Triglycerides
Table of contents
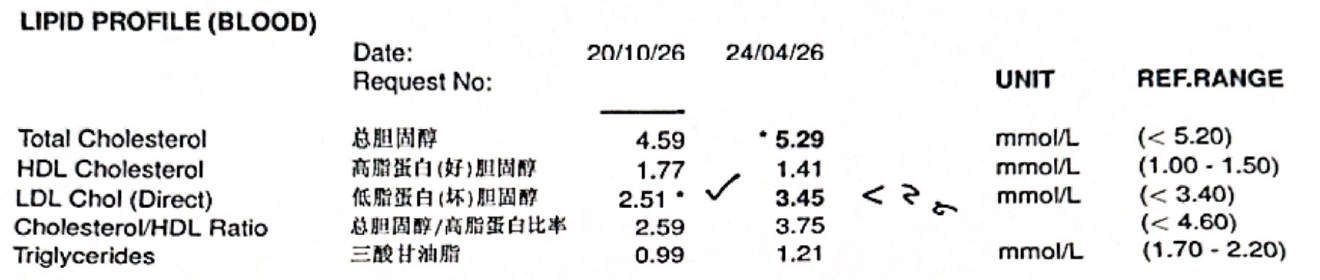
These are the rest of my standard lipid panel, the numbers that sit around LDL on the report. Between April and October 2026, all three moved the right way. One of them is now flagged “out of range”, but it’s out of range in the good direction.
Snapshot
| April 2026 | October 2026 | Lab range | Status now | |
|---|---|---|---|---|
| Total cholesterol | 5.29 mmol/L | 4.59 mmol/L | <5.20 | ✅ Normal |
| HDL cholesterol | 1.41 mmol/L | 1.77 mmol/L | 1.00–1.50 | ✅ Above range, which is good |
| Triglycerides | 1.21 mmol/L | 0.99 mmol/L | <1.70 | ✅ Lower |
| Total cholesterol/HDL ratio | 3.75 | 2.59 | <4.60 | ✅ Better |



The lipid section of my October report, with April’s results alongside:
What they are
- Total cholesterol is all the cholesterol in the blood: LDL, HDL and the rest added together. On its own it’s a blunt number, because it mixes the harmful and protective kinds.
- HDL (high-density lipoprotein) is the “good cholesterol”. HDL particles pick up excess cholesterol and carry it back to the liver to be cleared. Higher HDL is linked with lower heart risk.
- Triglycerides are the main form of fat the body stores and moves around for energy. High levels are linked with too many refined carbs and sugar, excess body fat, alcohol and insulin resistance.
- The total cholesterol/HDL ratio compares the two. Lower is better.
What I’m aiming for
My doctor didn’t set specific targets for these, since LDL and ApoB were the focus. So I’m aiming for:
- Total cholesterol under the lab’s 5.20 mmol/L.
- HDL comfortably above 1.0 mmol/L. The lab’s upper limit of 1.50 is just the edge of the population range; for HDL, being above it is usually a good sign.
- Triglycerides well under 1.70 mmol/L. Under about 1.0 fits a lean, active person eating a decent diet.
- Ratio well under 4.6.
Why April was a problem
Only total cholesterol was flagged in April, at 5.29 against a limit of 5.20. That was mostly LDL being high (3.45), which is the part that matters for heart risk.
HDL (1.41) and triglycerides (1.21) were fine in April, and the ratio of 3.75 was within range. So April wasn’t a problem across the whole panel. The concern was the harmful LDL fraction, covered in the LDL and ApoB articles.
Why October is better
- Total cholesterol fell to 4.59, back under the limit, mostly because LDL dropped.
- HDL rose from 1.41 to 1.77. The lab flags it as above range, but for HDL that’s in the good direction. Regular hard exercise and losing body fat are two of the most reliable ways to raise HDL, and I did both.
- Triglycerides fell from 1.21 to 0.99. That fits switching to lower-GI carbs such as brown rice, more protein, much less body fat (19.3% to 9.55%) and training up to 6 times a week before my competition.
- The ratio improved from 3.75 to 2.59.
The usual caveat applies: the blood was drawn 9 days after a weight cut, and a calorie deficit can push triglycerides and cholesterol down for a while.
What’s next
- Recheck the full lipid panel at the next blood test, at maintenance weight.
- Keep training and the lower-GI carbs going; those probably did the most for HDL and triglycerides.
This is my own personal data, shared for interest only. It’s not medical advice.
Until next time, peace and love!