Visceral Fat & Fat Distribution
Table of contents
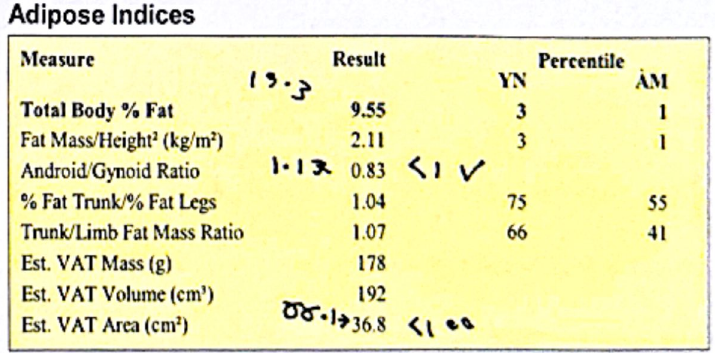
Total body fat is only half the story. Where the fat sits matters just as much for health, and my DEXA scan measures two things about that: visceral fat (the fat around your organs) and the android/gynoid ratio (belly fat compared with hip fat). In April my doctor set a target for the ratio. By October I’d hit it.
Snapshot
| April 2026 | October 2026 | My target | Status | |
|---|---|---|---|---|
| Visceral fat area | 66.1 cm² | 36.8 cm² | <100 | ✅ |
| Visceral fat mass | 319 g | 178 g | ||
| Android/gynoid ratio | 1.17 | 0.83 | <1 | ✅ |
| Trunk fat % / leg fat % | 1.29 | 1.04 |


The handwriting on the October report is my doctor’s: the April value with an arrow to the new one, and a tick against the target.
What it is
Visceral fat is the fat stored deep inside your abdomen, wrapped around the liver, gut and other organs. It’s different from the fat under your skin that you can pinch. Visceral fat is metabolically active: it releases fatty acids and inflammatory signals straight into the blood supply heading to the liver. The DEXA estimates it as an area (cm²) on a slice through the abdomen, plus a mass and volume.
Android vs gynoid are two regions the scan measures:
- Android is the belly area, between the bottom of the ribs and the top of the pelvis (“apple” shape).
- Gynoid is the hips and upper thighs (“pear” shape).
The android/gynoid ratio compares the fat percentage in the two. Above 1 means proportionally more fat on the belly than the hips.
What I’m aiming for
These targets came from my doctor at the April review:
- Visceral fat area under 100 cm².
- Android/gynoid ratio under 1.
Why April was a problem, and the risks
My visceral fat was actually fine in April (66.1 cm², well under 100). The issue was the distribution: an android/gynoid ratio of 1.17, with trunk fat high compared with leg fat (the 97th percentile for trunk-to-leg fat among young men).
Belly-heavy fat and visceral fat are linked more strongly to health problems than total body fat is:
- Insulin resistance and type 2 diabetes. My April HbA1c (5.7%) and fasting glucose (5.7 mmol/L) were both at the edge of the prediabetes range.
- Worse cholesterol. Higher LDL and ApoB. Mine were above my doctor’s targets in April.
- Fatty liver and heart disease over the long term.
So the April pattern lined up with the other numbers my doctor wanted improved.
Why October is better, and what probably helped
Visceral fat almost halved (66.1 → 36.8 cm²) and the ratio dropped to 0.83. What probably helped:
- Overall fat loss. I lost about 7.3 kg of fat for my BJJ competition cut, and visceral fat tends to come off faster than other fat when you’re in a calorie deficit and training a lot.
- Training volume. BJJ went from once a week to 6 times a week in competition prep, plus a full-body conditioning programme.
- Diet. More protein and lower-GI carbs such as brown rice, instead of more refined carbs.
The trunk lost the most fat of any region (about −4.3 kg), which is exactly where I needed it to come from. This lines up nicely with my LDL cholesterol and fasting glucose improving over the same period, though I can’t prove which change caused which.
What’s next
- This scan was four days after my competition, at my leanest. When I go back to eating at maintenance, some fat will come back. The goal is to keep the ratio under 1 and visceral fat well under 100 cm² while that happens.
- Recheck at the next DEXA.
This is my own personal data, shared for interest only. It’s not medical advice.
Until next time, peace and love!